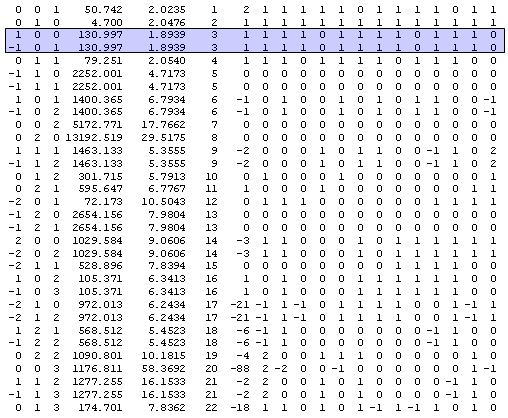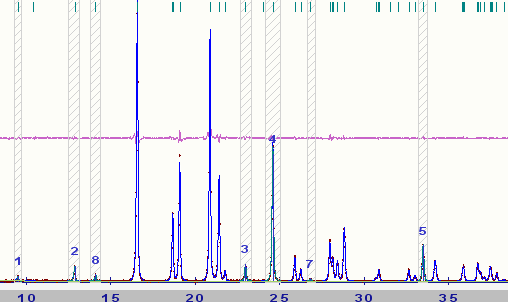
Figure 1: Output from the version of the Pawley program in Ref. [2] that form part of the DASH software.
Summary: This page describes the information needed to adapt your own powder decomposition software to work with ExtSym. To do this you first need to understand what input the ExtSym program requires. Most importantly, ExtSym does not work directly with raw powder data but requires the raw powder data in a processed format. This page details this processed format and explains how to generate it. For additional information see also Ref. [5].
This web page is structured as follows:
ExtSym only allows powder data to be read into the program in two formats that are closely related:
This format originates from the TF12LS program [2]. The .hkl format aims to summarize the output from a powder decomposition refinement and it contains:
To explain the .hkl format in detail let us first introduce the notation:
Further, let C denote a covariance matrix with dimensions P x P and Chk an element of this matrix. A normalised covariance element is calculated as Bh,k =100 * Chk / (Chh*Ckk)^1/2 (see Eq. (9) in Ref. [1] for more on this, although notice there is a typographical error in that equation: -1/2 should be replaced by 1/2).
The .hkl format stores an upper band of the normalised matrix elements; that is the elements: (Cii)^1/2, B i,i+1, B i,i+2,...., B i,i+n-1, Bi,i+n for all i = 1, 2, ...., P and n<=N. This correspond to ignoring the Bragg peak overlap between any two intensities that are separated by more then n intensities.
More specifically the .hkl format consists of lines having the form:
hkl Intensity(h) Chh^1/2 h Bh,h+1 Bh,h+2 .... Bh,h+n-1 Bh,h+n
where
Shown below is an example of what this format might look like for a real dataset:

The two lines highlighted in blue in Fig. 1 show an example where the DASH(TF12LS) program has decided not to treat the intensity for [1 0 0] and [-1 0 1] as two separate refineable variables but instead decided only to refine on the sum of these two intensities.
The output above was obtained from the powder decomposition of the Hydrochlorothiazide dataset described in Ref. [3]. A part of the powder pattern for this dataset is shown below for comparison with the Pawley output in Fig. 1:

For ExtSym to recognise that an input powder data file conforms to the .hkl format described above this file must have the extension .hkl. Similarly for ExtSym to recognise the format described in this subsection the input data file must have the extention .hkl_weight (this is not fantastic programming but was quick to implement). A .hkl_weight file presents a raw powder pattern in exactly the same way as a .hkl file except that the covariance matrix elements are stored in their inverse format, i.e. as weight matrix elements. To be precise a .hkl_weight file is required to conform to the .hkl format except for the following differences. A .hkl_weight file consists of lines:
hkl Intensity(h) Whh^1/2 h Xh,h+1 Xh,h+2 .... Xh,h+n-1 Xh,h+n
where
First introduce some notation in addition to the notation introduced at the beginning of the subsection of 'The .hkl format' above.
In a powder decomposition refinement the ith observed point in the diffraction pattern, yiobs, is compared against
 .
.where bi is the background value for the ith point in the diffraction pattern. Ih is the refineable intensity variable for Bragg reflection(s) h. It may contain the multiplicity, ph, or other factors depending on how fih is defined relative to Ih in a given powder decomposition software. fih should contain any contributions such that the yi calculated using the equation above can be successfully fitted to the yiobs. You might imagine that fih takes a form not too dissimilar from:
where Lh is the Lorentz-polarisation factor, Aih asymmetry and Gih normalised profile shape function value (notation used here is taken from Ref. [4]).
Values for the integrated intensities, Ih, may be obtained by using either the Le Bail or Pawley technique. Either way, at the end of such a refinement weight matrix elements can be calculated using the expression

The sum is over points in the diffraction pattern and sigma_i is the estimated standard deviation for the ith observed value, yiobs, in the pattern.
The ExtSym algorithm makes the assumption that, for the part of the pattern used in the Le Bail or Pawley fitting, the expected average intensity at any point in the fitted part of the pattern is the same. For this reason it is better not to have the multiplicity included as part of the fih in Eq. [1] since the multiplicity times the statistical weight for each reflection in a pattern is a constant (see Bricogne 1991 and references therein). Further, the inclusion of any other terms in the expression for fih in Eq. [1] which would balance the mean intensity to be closer to constant should make ExtSym work better; for example, correcting for the intensity falloff due to the temperature effect. However, in practice, it is found that ExtSym is fairly robust to some changes in the definition of fih in Eq. [1]. For example, the .hkl files produced by DASH do not include the multiplicity in the intensity values, but this output when slightly modified, as described in the following section, works very well with ExtSym as is demonstrated in Table 1.Once a translation script has been written for generating .hkl_weight (or .hkl) files from your favorite powder decomposition program, these files may with advantage be adjusted before used as input to ExtSym.
The extinction symbol probabilities calculated by ExtSym are strongly dependent on the ratios: 'intensity values' to 'covariance matrix element values' in comparison to the absolute values of these individually.
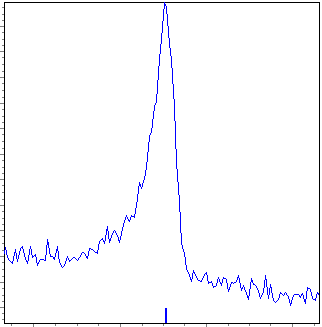
This is easy to understand by considering an isolated peak in a diffraction pattern that has one possible present Bragg reflection associated with it as illustrated in the figure below.

Say an extracted intensity of I=1000 has been refined for this peak. This information by itself is not useful to ExtSym because the main purpose of the program is to make judgments about the probability of certain peaks being present or absent, and knowing only the Bragg intensity is not enough for this. From Fig. 3 we should agree that the reflection associated with the tick mark under the peak is extremely likely to be present! However, imagine you had never seen the data in Fig. 3 before and only given the information that the intensity is I=1000; this information alone does not tell you whether this Bragg reflection is present or perhaps absent. But, if you were given the information that I=1000±1 then this information tells you that the reflection is extremely likely to be present whereas I=1000±10000 informs you that this reflection may or may not be present. ExtSym is no different. It does not 'see' the raw powder data, only the extracted intensities and covariance matrix elements and the ratios of these number must be a fair representation of the raw powder data.
As an example: performing a Pawley refinement using DASH (TF12LS) will in general return a .hkl file containing accurate normalised off-diagonal covariance matrix elements but the squared (diagonal) elements in column 5 or the .hkl may not be on an accurate absolute overall scale. These two programs Pawley refine against the squared of the goodness-of-fit (GOF):

where yi and yiobs are the ith calculated and observed data point in the diffraction pattern, N the number of such points and P the number of parameters which are refined. For a "perfect" fit GOF should close to one. However, perhaps due to awkward lineshapes, background, impurities, limitations of software etc. it is not uncommon that a best GOF ends up being say GOF=5. When calculating the covariance matrix by inverting the weight matrix in Eq. 2, the resulting matrix elements contain no history about the quality of the fit. By comparing Eq. 2 with Eq. 3 it is seen that these equations share the same denominator: 1/[sigma_i]^2. Thus, to partially include in the covariance matrix elements an awareness of not perfected fitted data by the decomposition refinement it is here suggested that the weight matrix is divided by (A*GOF)^2, which equates to multiplying the covariance matrix by the same number or multiplying the sigma_i's in Eq. 1 by A*GOF, where A is a parameter you unfortunately have to determine. It depends on the specific powder decomposition implementation you are using. See the ExtSym test web page for examples of how a good value for A can be determined. The value A*GOF is set in the ExtSym parameter input file advanced.asc. Note that, for a powder diffraction package that performs consistent good Pawley or Le Bail fit, and which follow the recommendations of this page you should expect to find a best performing value for A close to one.
Keep in mind that the above is only a suggestion for how to include in the covariance matrix a reminder about a possible refinement misfit; it is expected to be more accurate when the misfit is distributed throughout the pattern rather than being a large discrepancy in a narrow region of the pattern.
A .hkl (or .hkl_weight) file should be prepared from a refinement of the diffraction pattern in a space group that has no systematic absences. Examples of such space groups are listed below for the various crystal systems: