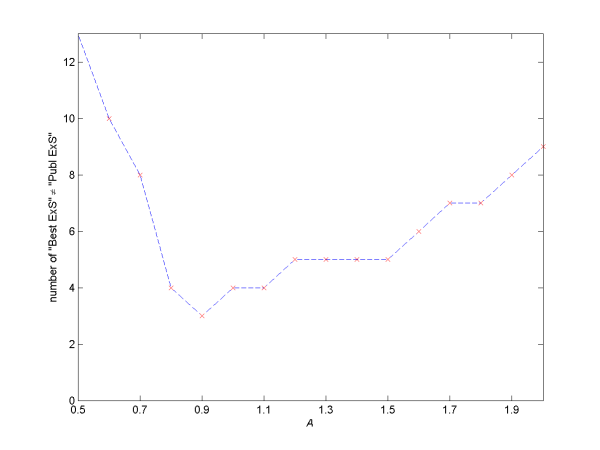
Figure 1: Shows the performance of ExtSym as a function of the parameter A as described in the text. For each value of A, the y-axis shows the number of datasets for which the "Best ExS" is different from the "Publ ExS" in Table 2.
Summary: The program ExtSym is tested against published data, where for each dataset the most probable extinction symbol as calculated by ExtSym is compared with the published extinction symbol. Many of the results presented here are also published in Ref [23].
This web page is structured as follows:
I am very grateful to those who have sent me data to test the ExtSym program. Please see the references to these excellent works at the bottom of this page. These works cover lab-X-ray, time-of-flight neutron, constant wavelength neutron and synchrotron X-ray data collected on a broad spectrum of compounds.
The test results are displayed in tables, see for instance Table 1, with one ExtSym test per row. The columns of these tables contain:
Some of the numbers in each row (that is each ExtSym test) link various pictures and output/input files related to that ExtSym test. In addition where permission has been given the raw data can be downloaded by either right clicking (and choose save as from the right click menu) on the number in the "Refs" column or for the datasets published in Ref. [3] these can be downloaded from www.powderdata.info. These links may for instance be used by anyone interested in double checking the test results presented on this web page.
Finally, light grey coloured rows show tests for which the top ranked extinction symbol did not match the published symbol. These tests are discussed further in the section entitled "Datasets for which the published symbol does not equal the most probable symbol".
For some information about the program DASH click here.
It was found by Kenneth Shankland / Bill David in collaboration with CCDC that the Pawley implementation used in DASH worked well with ExtSym with A=3. This is also confirmed from the results in Table 1.
Notice that on 25/05/2005 the following bug was found in the script that prepares the DASH output for the ExtSym program. For versions prior to 25/5/2005 whenever GOF is larger than 10 this script mistakenly reassign it to one! Which, for reasons that can be understood by reading this, renders the corresponding output from ExtSym useless.
Prior to the Pawley refinements performed to populate Table 1, the background was first subtracted using the background removing algorithm in DASH with the following settings: 'the Monte Carlo' tick box not ticked and with ' NoI=20,Window=40'. Many of the Pawley refinements used for the tests in this table were done by Kenneth Shankland.
Table 1:
| Dataset | Ref. | GOF | 3*GOF | Best ExS | Publ ExS |
|---|---|---|---|---|---|
| Lab_C7H8ClN3O4S2 | [3] |
P 1 21 1 |
|||
| Lab_C7H6O2S | [3] |
P 1 21/c 1 |
|||
| Lab_C12H10N4 | [3] |
P 1 21/c 1 |
|||
| Lab_C15H12N2O | [3] |
P 1 21/n 1 |
|||
| Lab_C12H12N2O2S | [3] |
P 21 21 21 |
|||
| Lab_C8H8F3N3O4S2 | [3] |
P 1 21 1 |
|||
| Lab_C8H9NO2 (form I) | [3] |
P 1 21/n 1 |
|||
| Lab_C8H9NO2 (form II) | [3] |
P b c a |
|||
| Lab_C36H30Cl2NiP2 | [3] |
P 1 c 1 |
|||
| Lab_C9H11N2O2S Cl | [3] |
P 1 21/a 1 |
|||
| Lab_C8H12NO2 Br | [3] |
P b c - |
|||
| Lab_C18H17NO2 | [3] |
P n a - |
|||
| Lab_C15H12N2O 2H2O | [3] |
C - c (ab) |
|||
| Lab_C12H9N2O4S Na 2H2O | [3] |
P b c n |
|||
| BM16_C7-H11-N5-O2 | P 1 21/n 1 |
||||
| BM16_C6-H6-N6-O4_H2O | P 1 21/n 1 |
||||
| Daresbury_zeolite_NU-3_QUIN | R - - - |
||||
| SNBL_zeolite_VPI-9 | P 41 21 - |
For information about how to transform Topas output into ExtSym input, see here.
Tom Griffin provided a C# batch script for automating the testing of ExtSym on many datasets. This script was used on the 53 datasets listed in Table 2 to find an optimised value for the 'rescale data error' parameter in advanced.asc. This parameter assumes the form A * GOF (see here), where GOF is the Goodness Of Fit and the prefactor A is the parameter to be determined. Figure 1 plots the parameter A as a function of how many of the 53 datasets result in the "Best ExS" (most probable symbol) being not equal to the "Publ ExS" (published symbol) . The lower this number the better ExtSym is said to have performed. From Figure 1 it is seen that the best region for the parameter A is 0.8 to 1.5 with 0.9 being the best value. In an ideal world A should be close to 1, which is satisfied for the Topas outputs studied in Figure 1.

For this dataset (unpublished data, Richard Ibberson) the correlation matrix returned by Topas is not quite right (or [less likely I believe] the script for translating the topas output into a .hkl somehow scrabble the Topas correlation matrix). The Topas .inp file used to fit these data, the .hkl file produced from this .inp file and the ExtSym output can be downloaded from here, here and here. Also, the same data was Pawley fitted with the TF12LS program (Richard), and the .hkl and ExtSym output can be downloaded from here and here. The ExtSym output using the TF12LS .hkl file is plausible but the ExtSym output from the Topas .hkl file is definitely not reasonable. If someone manage to fix this problem please let me know. Notice for all the other data tested in Table 2 no such problem was observed.
Table 2:
For some information about the program PRODD click here.
GOF is set equal to the square root of the Chi^2 value printed to screen by the PRODD program.
Only 3 datasets have been tested with PRODD so far and no attempt was made to find a best value of the 'A' parameter; the first choice simply happened to be A=2. The Pawley refinements used for the ExtSym tests in table 3 were all provided by Richard Ibberson and the input (.ccl) PRODD files can be downloaded by clicking on the dataset names in the first column.
Table 3:
| Dataset | Ref. | GOF | 2*GOF | Best ExS | Publ ExS |
|---|---|---|---|---|---|
| HRPD_2CH3O_SO2_5K | [21] |
1.3583 | 2.716 | I 1 a 1 | I 1 a 1 |
| HRPD_2CH3O_SO2_225K | [21] |
2.418 | 4.836 | F d d - | F d d - |
| HRPD_CD3_2_SO2 | [22] |
1.749 |
C - c - |
For info about the program FullProf and the script used to generate the result in the table below click here.
Only 1 dataset has been tested with FullProf and no attempt has been made to find a best value of the 'A' parameter; the first choice simply happened to be A=2. The FullProf input parameter file (.pcr) used for each test can be downloaded by clicking on the dataset name in the first column.
Table 4:
| Dataset | Ref. | GOF | 2*GOF | Best ExS | Publ ExS |
|---|---|---|---|---|---|
| Lab_C7H8ClN3O4S2 | [3] |
2.598 | 5.195 | P 1 21 1 | P 1 21 1 |
For info about the program GSAS and the script used to generate the result in the table below click here.
Only 1 dataset has been tested with GSAS output and no attempt has been made to find a best value of the 'A' parameter; the first choice was simply to use A≈2. Note the ExtSym output (downloadable by clicking on the link in the Best ExS column) appears to give the extinction symbols "I 1 - 1" and "I 1 a 1" the same probability.
Table 4:
| Dataset | Ref. | GOF | ~2*GOF | Best ExS | Publ ExS |
|---|---|---|---|---|---|
| HRPD_2CH3O_SO2_5K | [21] |
2.42 | 5.0 | I 1 - 1 / I 1 a 1 | I 1 a 1 |
Dataset |
Explanation |
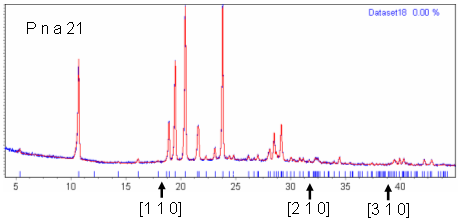
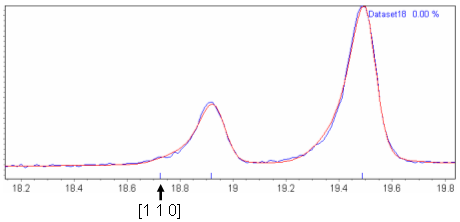
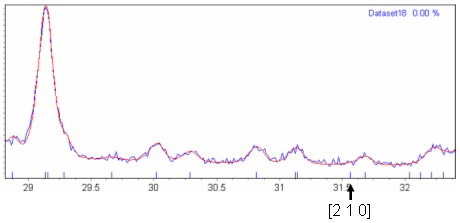
| Lab_C18H17NO2 | "P n a -" and "P n a b" have exactly the same systematic absences, except that "P n a b" also predicts that all [h k 0] reflections with h≠0 and k odd are systematically absent. Figure 2 shows a Pawley fit of this dataset in space group "P n a 21"; "P n a 21" has extinction symbol "P n a -". The three reflections highlighted below the diffraction pattern in this figure are predicted to be absent in "P n a b" but present in "P n a -". Figures 3 (a-c) show blown up pictures of the pattern around each of these Bragg positions. As can be seen there is basically zero evidence in the data that these reflections are present and hence the reason for ExtSym to prefer "P n a b" to "P n a -". From email discussions with John Evens, it just so happens that for this system the crystal structure is such that all [h k 0] reflections with h≠0 and k odd are nearly zero. |
| SNBL_zeolite_VPI-9 | An example where the naked eye do better than ExtSym. The program thinks the best extinction symbol is 'P - c -' whereas the correct space group is 'P 42 21 2'. A space group that has extinction group 'P - c -' is for instance 'P 42 c m'. For Pawley refinements in space groups 'P 4 2 2', 'P 42 41 2' and 'P 42 c m' see here, here and here. Although the discrepancy is not large it is clear that by studying the region around 2theta=6 that the space group 'P 42 21 2' provides a better choice than 'P 42 c m'. This highlight the importance of considering the output of ExtSym as a guide and not as a final answer. |
| Daresbury_zeolite_VPI-5 | The published extinction symbol "P 63 - -" is ranked second and "P - c -" ranked first. The latter symbol predicts all [h -h l], [0 h l], [-h 0 l] with l odd to be absence, and looking at the pattern, or the .hkl file (or .inp file) that can be downloaded with this test, there seem to be very little evidence of the [0 h 1] reflections with h=1,2,3,4 (did not check further up the pattern), hence this must be another example where these reflections are present but just very tiny. |


Figure 3(a): Zoomed in region of Figure 2 around the [1 1 0] Bragg position.


Figure 3(c): Zoomed in region of Figure 2 around the [3 1 0] Bragg position.